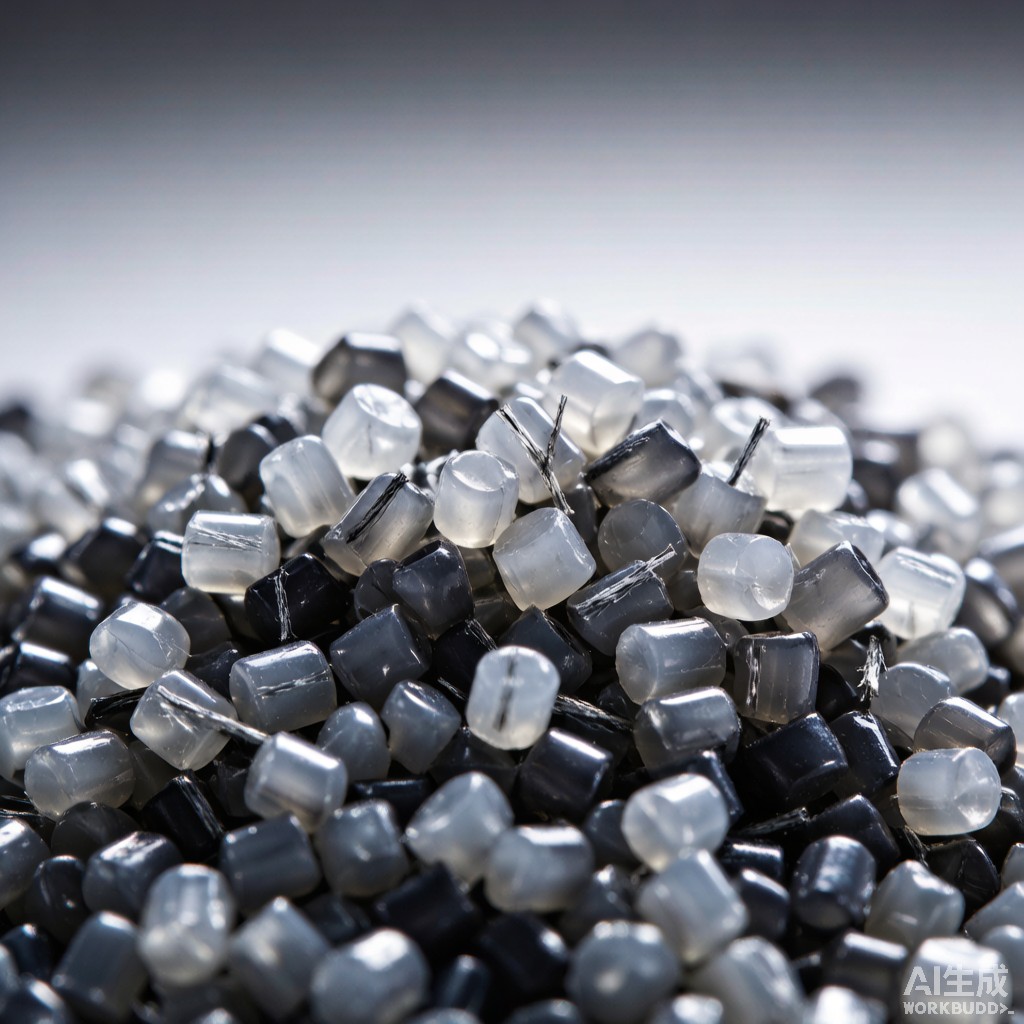
Glass fiber reinforcement is the most widely employed modification technique for engineering thermoplastics used in electronics housings, co
ectors, and structural components. By adding chopped glass fibers (typically 3–4.5 mm initial length, 10–14 μm diameter) to polymer matrices, manufacturers achieve dramatic improvements in mechanical properties, dimensional stability, and heat resistance. However, glass fiber loading is not a case of ‘more is better.’ Each incremental increase in GF content introduces trade-offs in impact toughness, surface aesthetics, mold flow, and tooling wear that must be carefully balanced against application requirements. This article provides a systematic analysis of glass fiber loading effects from 10% to 40% by weight in the three most common electronics-grade modified plastics: polypropylene (PP), polyamide 66 (PA66), and polybutylene terephthalate (PBT).
Glass Fiber Fundamentals in Thermoplastics
Fiber Architecture and Sizing Chemistry
Commercial chopped glass fibers for thermoplastic compounding consist of E-glass (aluminoborosilicate) filaments coated with a sizing chemistry specifically formulated for polymer matrix compatibility:
- Silane coupling agent: Organofunctional silane (aminosilane for PA/PBT, methacrylsilane for PP) bonds to glass surface hydroxyls
- Film former: Polyurethane or epoxy protecting filaments during extrusion
- Lubricant: Fatty acid ester or paraffin reducing fiber-fiber abrasion during processing
- Antistatic agent: Prevents static buildup that causes fiber balling
During twin-screw extrusion compounding, the initial 3–4.5 mm fibers are reduced to a final length distribution centered around 200–400 μm (L/D ratio ≈ 20–40). Fiber length retention is critical: shorter fibers provide less reinforcement efficiency but better surface finish and mold flow.
Reinforcement Mechanism
Glass fibers reinforce polymers through load transfer from the matrix to the higher-modulus fiber. The efficiency of this transfer depends on:
- Aspect ratio (L/D): Higher aspect ratios increase critical fiber length and stress transfer efficiency
- Fiber orientation: Aligned fibers provide maximum stiffness in the flow direction but create anisotropic shrinkage
- Interfacial shear strength: Sizing chemistry and matrix wetting determine load transfer at the fiber-matrix interface
- Volume fraction: Percolation threshold for mechanical co
ectivity typically occurs at 10–15 wt% GF
Mechanical Property Progression with GF Loading
Tensile Strength Development
| GF Loading | PP Tensile (MPa) | PA66 Tensile (MPa) | PBT Tensile (MPa) | Improvement Factor |
|---|---|---|---|---|
| 0% (neat) | 32 | 82 | 55 | 1.0× |
| 10% GF | 42 | 105 | 72 | 1.3–1.4× |
| 20% GF | 52 | 130 | 92 | 1.6–1.7× |
| 30% GF | 62 | 155 | 110 | 1.9–2.0× |
| 40% GF | 70 | 175 | 125 | 2.2–2.3× |
Tensile strength increases approximately linearly with GF loading up to 30%, after which diminishing returns occur as fiber-fiber interactions begin to dominate over fiber-matrix load transfer. The 10–20% GF range captures approximately 60% of the total strength improvement achievable at 40% loading.
Flexural Modulus Development
| GF Loading | PP Flex Mod (GPa) | PA66 Flex Mod (GPa) | PBT Flex Mod (GPa) |
|---|---|---|---|
| 0% | 1.4 | 2.8 | 2.5 |
| 10% GF | 2.2 | 4.2 | 3.8 |
| 20% GF | 3.2 | 5.8 | 5.2 |
| 30% GF | 4.5 | 7.8 | 7.0 |
| 40% GF | 6.0 | 9.5 | 8.8 |
Flexural modulus shows stronger dependence on GF loading than tensile strength, with 40% GF achieving 4.3× (PP) to 3.4× (PA66) improvements over neat resin. This makes high-GF grades essential for structural components requiring rigidity under load.
Impact Strength Trade-Off
Notched Izod impact strength exhibits a characteristic non-monotonic behavior:
| GF Loading | PP Izod (J/m) | PA66 Izod (J/m) | PBT Izod (J/m) |
|---|---|---|---|
| 0% | 45 | 55 | 45 |
| 10% GF | 55 | 75 | 60 |
| 20% GF | 50 | 80 | 65 |
| 30% GF | 40 | 70 | 55 |
| 40% GF | 30 | 55 | 40 |
Impact strength peaks at 15–25% GF loading, then declines as fiber-fiber stress concentrations and reduced matrix ductility dominate. For applications requiring both strength and toughness—such as SMT co
ector housings subject to insertion forces—20% GF represents the optimal compromise for most polymers.
Thermal and Dimensional Properties
Heat Deflection Temperature
| GF Loading | PP HDT (°C, 1.8 MPa) | PA66 HDT (°C) | PBT HDT (°C) |
|---|---|---|---|
| 0% | 55 | 75 | 60 |
| 10% GF | 85 | 120 | 100 |
| 20% GF | 110 | 160 | 140 |
| 30% GF | 130 | 200 | 175 |
| 40% GF | 145 | 235 | 205 |
HDT improvement is particularly dramatic in crystalline polymers like PA66 and PBT, where fiber reinforcement restrains polymer chain mobility near the crystalline melting region. PP-GF40 achieves HDT of 145°C, sufficient for most automotive under-hood applications but marginal for lead-free reflow (peak 260°C).
Mold Shrinkage and Warpage
Glass fiber reinforcement dramatically reduces overall shrinkage but introduces anisotropy:
| GF Loading | PA66 Flow Shrink (%) | PA66 Transverse Shrink (%) | Anisotropy Ratio |
|---|---|---|---|
| 0% | 1.5 | 1.5 | 1.0 |
| 10% GF | 1.0 | 1.3 | 1.3 |
| 20% GF | 0.6 | 1.1 | 1.8 |
| 30% GF | 0.3 | 0.9 | 3.0 |
| 40% GF | 0.15 | 0.7 | 4.7 |
Flow-direction shrinkage decreases nearly linearly with GF loading as fibers restrain polymer contraction. However, transverse shrinkage (perpendicular to flow) decreases more slowly, creating increasing anisotropy. At 30–40% GF, anisotropy ratios of 3–5× cause significant warpage in non-symmetric parts, requiring careful gate placement, cooling cha
el design, and mold temperature control.
Processing and Moldability Considerations
Melt Viscosity and Flow Length
Increasing GF content raises melt viscosity through both fiber-fiber interaction and increased polymer-fiber interfacial area:
| GF Loading | MFI Change (PP, 230°C/2.16kg) | Spiral Flow Length Change |
|---|---|---|
| 10% GF | −20% | −15% |
| 20% GF | −40% | −30% |
| 30% GF | −55% | −45% |
| 40% GF | −65% | −55% |
The reduced flow length at high GF loadings limits thin-wall molding capability. For co
ector housings with wall thickness of 0.8–1.2 mm, 30% GF represents the practical upper limit for conventional injection molding. 40% GF grades require thicker walls (≥1.5 mm), higher injection pressures (≥150 MPa), or hot ru
er systems with sequential valve gating.
Surface Quality and Fiber Read-Through
Glass fibers near the part surface create visible ‘read-through’ patterns and rough texture:
- 10–15% GF: Minimal surface effect; suitable for cosmetic Class A surfaces with textured tooling
- 20–25% GF: Slight fiber read-through; acceptable for functional enclosures with matte or textured finish
- 30% GF: Noticeable surface roughness; requires 0.5–1.0 μm deeper etch texture to mask fibers
- 40% GF: Prominent fiber exposure; typically limited to internal structural components or requires painting/overmolding
Tool Wear
Glass fibers are abrasive. Mold tool wear rates increase with GF loading:
| GF Loading | Relative Tool Wear Rate | Recommended Tool Steel | Expected Mold Life (shots) |
|---|---|---|---|
| 0–15% GF | 1.0× | P20, NAK80 | 500,000+ |
| 20% GF | 2.5× | H13, S136 | 300,000–500,000 |
| 30% GF | 5.0× | H13 + nitriding, S136H | 200,000–350,000 |
| 40% GF | 8.0× | CPM 10V, carbide inserts | 100,000–200,000 |
At 40% GF, conventional tool steels experience unacceptable galling and dimensional drift within 50,000 shots. Premium materials (powder metallurgy tool steels or tungsten carbide inserts) with PVD coatings (TiAlN, AlCrN) become mandatory, increasing mold cost by 40–80%.
Application-Specific Selection Guidelines
Electronics Co
ector Housings (SMT)
| Requirement | Recommended GF Loading | Rationale |
|---|---|---|
| Standard 0.5 mm pitch co
ectors |
15–20% GF (PA66 or PBT) | Balances strength, flow, and surface quality |
| High-temp reflow (>250°C peak) | 30–35% GF (PPS or PA46) | Maximizes HDT while maintaining moldability |
| Large backplane co
ectors |
25–30% GF (PA66) | Higher stiffness prevents deflection under insertion force |
| FPC/FFC zero-insertion-force housings | 10–15% GF (LCP or PBT) | Minimizes warpage for precise latch engagement |
Electronics Enclosures and Brackets
| Requirement | Recommended GF Loading | Rationale |
|---|---|---|
| Handheld device housings (cosmetic) | 10% GF (PC/ABS or PP) | Minimal fiber read-through; good impact strength |
| Server chassis internal brackets | 30% GF (PA66) | Maximum stiffness for card retention |
| Outdoor enclosure (UV + load bearing) | 20–25% GF (PP + UV stabilizer) | Balanced properties with weather resistance |
| EMI shielding housing | 15–20% GF + conductive filler | Acceptable strength without compromising conductivity |
Moisture Absorption in Southeast Asian Climates
Glass fiber modification does not reduce—and can slightly increase—moisture absorption in hygroscopic matrices like PA66. Equilibrium moisture content at 85% RH, 30°C:
| Material | Equilibrium Moisture (%) | HDT Loss at Saturation |
|---|---|---|
| Neat PA66 | 2.5–2.8% | −30°C |
| PA66-GF30 | 2.2–2.5% | −25°C |
| PA66-GF40 | 2.0–2.3% | −20°C |
| Neat PBT | 0.3–0.4% | −5°C |
| PBT-GF30 | 0.25–0.35% | −3°C |
For tropical Southeast Asian applications, pre-mold drying remains essential: PA66-GF grades require 120–130°C for 4–6 hours to achieve <0.1% moisture, while PBT-GF grades need 120°C for 3–4 hours. Inadequate drying causes hydrolytic degradation during molding, reducing molecular weight and mechanical properties by 15–30%.
Conclusion
Glass fiber loading optimization requires balancing competing performance objectives against processing constraints and cost. For most electronics applications, 20% GF provides the optimal compromise—capturing approximately 65% of the stiffness improvement achievable at 40% loading while maintaining acceptable impact strength, surface quality, and moldability.
Thirty percent GF loading becomes justified when maximum stiffness and heat resistance are paramount, such as high-pin-count co
ectors and structural brackets, provided that mold design accommodates the increased anisotropy and tool wear. Forty percent GF should be reserved for extreme structural applications where surface aesthetics are secondary and mold tooling investment can be amortized over high production volumes.
For Southeast Asian compounders and molders, the tropical climate adds moisture management as a critical process control variable. Regardless of GF loading, rigorous drying protocols and climate-controlled material storage (≤40% RH, ≤25°C) are non-negotiable prerequisites for achieving consistent mechanical properties in glass-fiber reinforced modified plastic pellets.