Introduction: From Passive Boxes to Intelligent Air Management Systems
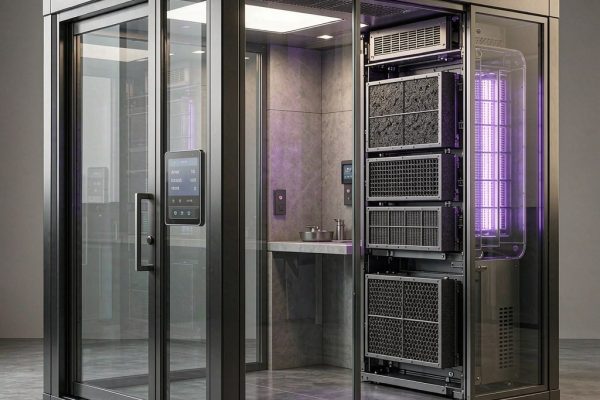
Traditional commercial smoking booths are passive mechanical systems: a fan pulls air through a fixed sequence of filters, and a maintenance technician replaces filters on a calendar schedule (e.g., every 3 months) regardless of actual usage or contamination load. This approach is inefficient — filters in low-traffic locations are replaced prematurely, while filters in high-traffic airports or hospitals may fail before their scheduled change date, exposing non-smoking occupants to environmental tobacco smoke (ETS) and violating indoor air quality (IAQ) regulations.
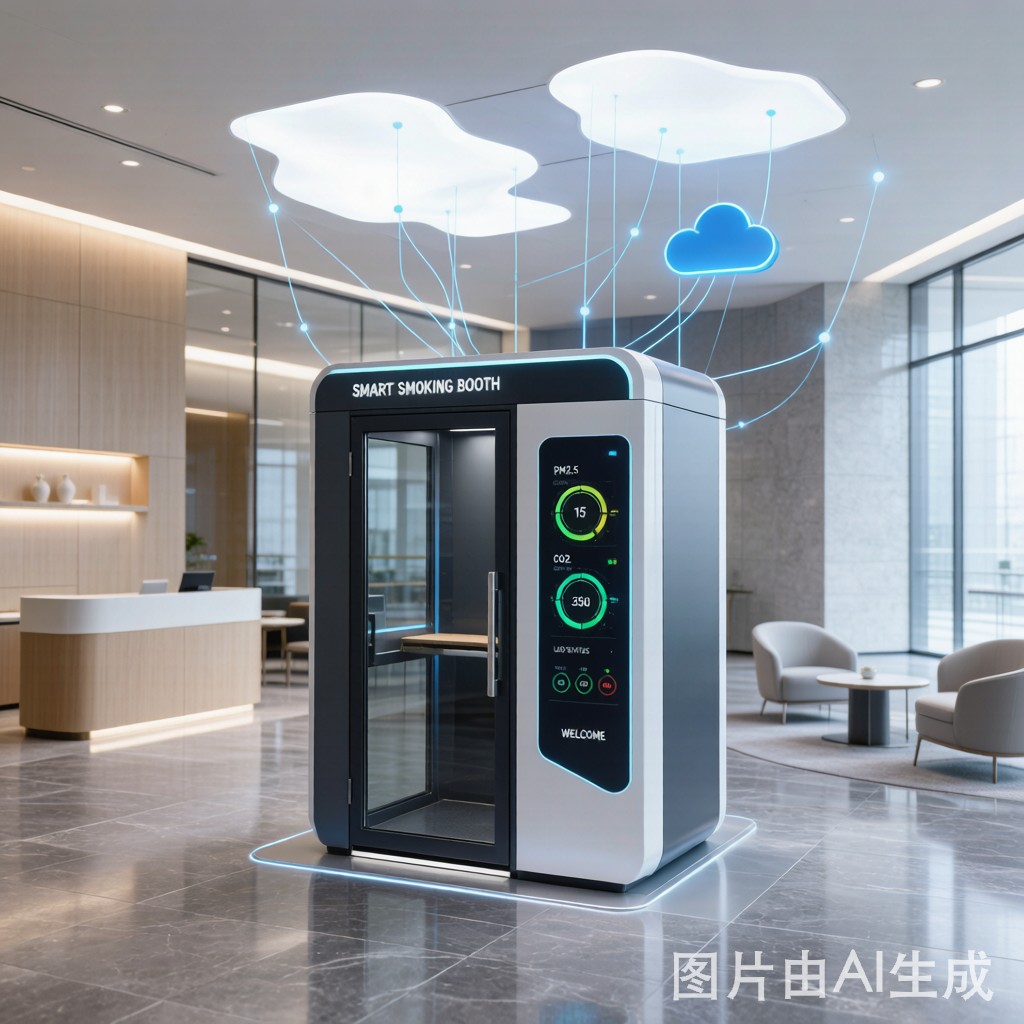
IoT-enabled smart smoking booths transform this paradigm by instrumenting the booth with a network of sensors, co
ecting it to a cloud analytics platform, and applying predictive algorithms to optimize filter replacement timing, energy consumption, and operational reliability. This article provides an engineering design guide for smart smoking booth systems, covering sensor architecture, data analytics, predictive maintenance algorithms, and energy optimization strategies.
IoT Sensor Network Architecture
Onboard Sensor Suite
A comprehensive smart smoking booth integrates multiple sensor types, each measuring a different aspect of system performance:
| Sensor | Measured Parameter | Technology | Accuracy | Purpose |
|---|---|---|---|---|
| PM2.5/PM10 sensor | Particulate concentration (μg/m³) | Laser scattering (Sharp GP2Y, Plantower PMS) | ±10 μg/m³ | Filter efficiency verification |
| CO₂ sensor | Carbon dioxide (ppm) | NDIR (Sensirion SCD30) | ±30 ppm + 3% | Occupancy detection, ventilation adequacy |
| TVOC sensor | Total volatile organic compounds (ppb) | Metal oxide semiconductor (Sensirion SGP30) | ±15% | Activated carbon filter saturation |
| Differential pressure sensor | Filter pressure drop (Pa) | MEMS piezoresistive (Honeywell HSC) | ±1% FS | Filter clogging detection |
| Temperature/humidity | ambient conditions | Capacitive RH + thermistor (SHT30) | ±2% RH, ±0.3°C | Environmental compensation |
| Current sensor | Fan motor power (A) | Hall effect (ACS712) | ±1.5% | Fan health, energy monitoring |
| Door/contact sensor | Occupancy event | Magnetic reed switch | Binary | Usage counting, security |
Edge Computing and Co
ectivity
Sensor data is processed at the edge by a microcontroller (STM32, ESP32, or Raspberry Pi Pico W) ru
ing a lightweight real-time operating system. The edge processor performs three critical functions:
- Local anomaly detection: If PM2.5 downstream of the HEPA filter exceeds 15 μg/m³ (indicating filter breakthrough or seal failure), the edge processor triggers an immediate local alarm ( audible + visual LED) without waiting for cloud co
ectivity
- Data aggregation and compression: Raw sensor data at 1 Hz is downsampled to 1-minute averages for transmission, reducing cellular data usage by 98%
- Offline buffering: 72 hours of data are stored locally in flash memory; if co
ectivity is lost, data is transmitted in batch when co
ection is restored
Co
ectivity options depend on facility infrastructure: Wi-Fi (preferred, zero data cost), Ethernet POE (most reliable), LoRaWAN (for outdoor or basement installations), or 4G/LTE cellular (for standalone deployments). A dual-co
ectivity strategy (Wi-Fi primary + 4G fallback) ensures >99.5% uptime.
Cloud Analytics and Filter Lifecycle Prediction
Data Model and Key Metrics
Cloud analytics platforms (AWS IoT, Azure IoT Hub, or facility-specific SCADA) ingest data from all smoking booths in a portfolio and compute facility-level and unit-level metrics:
- Filter Loading Index (FLI): A normalized 0–100 scale combining pressure drop increase, PM2.5 penetration rate, and TVOC breakthrough. FLI = 0 is a new filter; FLI = 100 is end-of-life.
- Clean Air Delivery Rate (CADR) degradation: CADR(t) = CADR₀ × (1 − FLI/120), where CADR₀ is the rated clean air delivery rate of the new filter system. When CADR drops below 80% of rated, replacement is recommended.
- Energy Efficiency Index (EEI): CADR per watt of fan power. As filters clog, fan power increases (at constant speed) or airflow decreases (at constant power), reducing EEI by 20–40% over filter life.
Predictive Replacement Algorithm
Instead of calendar-based replacement, the predictive algorithm estimates remaining filter life based on actual loading rate:
Remaining Life (days) = (100 − FLI) / (dFLI/dt)
Where dFLI/dt is the filter loading rate (FLI points per day), computed from a 7-day rolling average. The algorithm accounts for:
- Traffic pattern: A booth with 200 uses/day loads filters 4× faster than one with 50 uses/day
- Environmental factor: High ambient PM (construction sites, dry seasons) increases pre-filter loading
- Seasonal adjustment: Humid monsoon seasons may reduce activated carbon adsorption capacity by 15–25%
When Remaining Life falls below 14 days, the system generates a work order in the facility management CMMS (Computerized Maintenance Management System) with automatic parts ordering. When Remaining Life falls below 3 days, the booth displays a red “Service Required” warning to users and sends an urgent alert to facilities.
Energy Optimization Strategies
Variable Speed Fan Control
Standard smoking booths operate fans at fixed speed, consuming constant power regardless of occupancy. A smart booth uses variable speed control (EC motor with 0–10V or PWM input) to modulate airflow:
| Mode | Trigger | Fan Speed | Airflow (m³/h) | Power (W) | Energy Savings |
|---|---|---|---|---|---|
| Standby | No occupancy > 5 min | 20% | 120 | 8 | Baseline |
| Standard | 1 occupant | 60% | 360 | 35 | — |
| High | 2+ occupants or PM spike | 100% | 600 | 85 | — |
| Purge | Post-occupancy > 30 min | 40% | 240 | 18 | — |
For a booth with average 4 hours/day occupied and 20 hours/day standby, variable speed control reduces a
ual energy consumption by 55–65% compared to fixed-speed operation — from ~750 kWh/year to ~280 kWh/year. At Southeast Asian commercial electricity rates ($0.08–0.15/kWh), this saves $35–70/year per booth. For a facility with 20 booths, a
ual savings reach $700–1,400.
Demand-Responsive Ventilation
In facilities with multiple smoking booths (airports, large office complexes), the IoT platform can implement demand-responsive ventilation: when all booths are in standby mode, the central exhaust system reduces speed proportionally. When one booth enters high mode, the central system pre-emptively increases speed to prevent backpressure. This coordination reduces central HVAC energy by 15–25%.
Remote Diagnostics and Fleet Management
Dashboard and Alerting
The facility management dashboard displays:
- Fleet health map: Green (normal), yellow (maintenance due within 14 days), red (urgent service required), gray (offline)
- Filter inventory forecast: Projected filter consumption by type (pre-filter, HEPA, carbon) for the next 90 days, enabling just-in-time procurement
- Energy reports: Per-booth and fleet-level energy consumption, CO₂ emissions, and cost trends
- Compliance documentation: Automated generation of IAQ audit logs showing PM2.5, CO, and TVOC levels before and after each booth
Predictive Failure Detection
Beyond filter replacement, the sensor network detects equipment failures before they cause IAQ violations:
- Fan bearing wear: Current draw increases by 15–30% as bearings degrade; vibration frequency analysis (if accelerometer is added) detects bearing faults 2–4 weeks before failure
- HEPA seal degradation: Downstream PM2.5 rises while pressure drop remains normal — indicating bypass leakage around the filter gasket
- Carbon filter saturation: TVOC breakthrough occurs before pressure drop increases; early detection prevents odor complaints
Conclusion
IoT-enabled smart smoking booths represent a generational leap from passive mechanical boxes to intelligent air management nodes. By instrumenting the booth with a multi-sensor edge network, co
ecting to cloud analytics, and applying predictive algorithms, facility managers achieve three simultaneous benefits: (1) filter replacement costs are reduced by 20–30% through condition-based maintenance instead of calendar replacement; (2) energy consumption is reduced by 55–65% through variable-speed fan control and demand-responsive ventilation; and (3) IAQ compliance is assured through real-time monitoring and predictive failure detection. For commercial facilities with 10+ smoking booths, the return on investment for smart upgrades is typically 12–18 months. As indoor air quality regulations tighten across Southeast Asia, smart smoking booths will transition from a competitive advantage to a regulatory necessity.