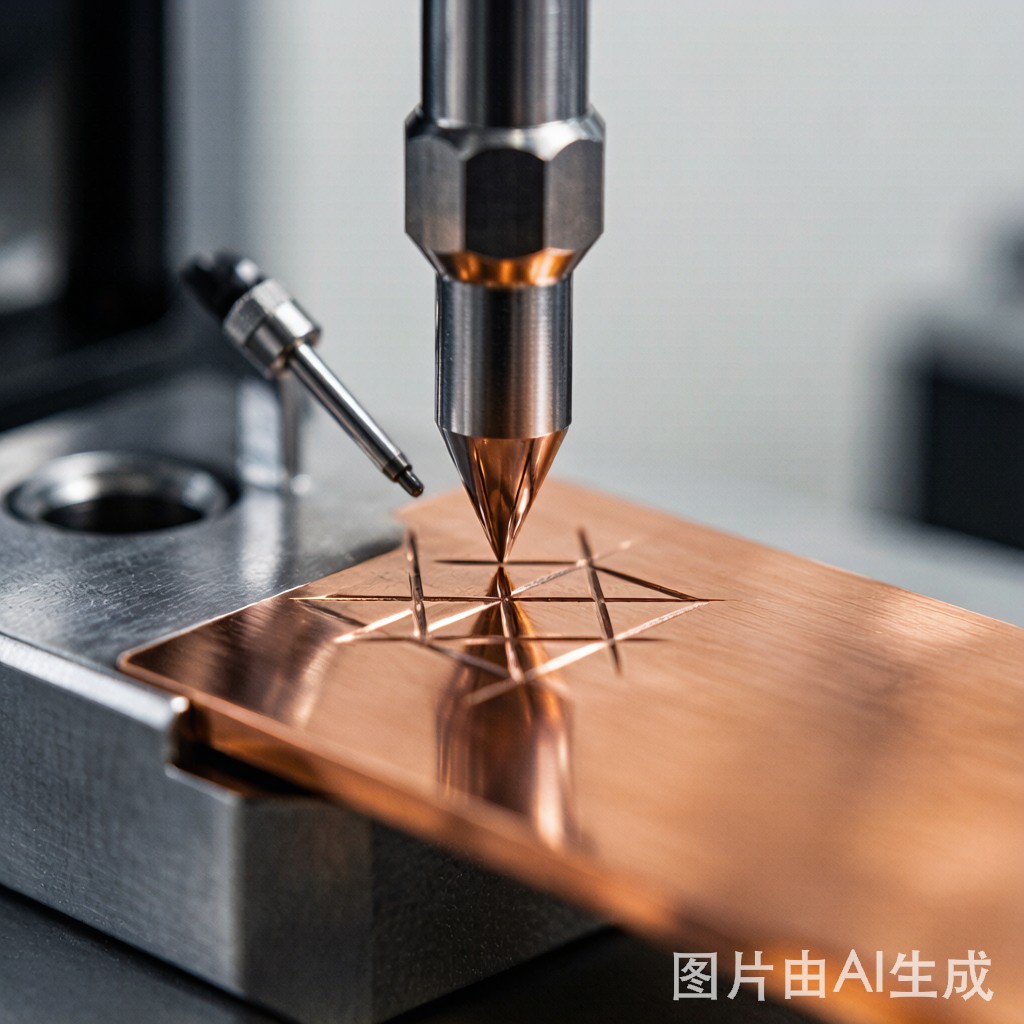
## Micro-Hardness: The Precision Temper Verification Tool
Copper strip destined for SMT lead frames, co
ector contacts, and EMI shielding components must arrive at the stamping press with precisely controlled temper—the combination of strength and ductility imparted by controlled cold working (rolling reduction) and a
ealing. The temper designation (1/4 Hard, 1/2 Hard, H02, H04, etc.) on the material certificate represents a specific range of mechanical properties that determine whether the strip will form correctly in progressive die tooling or fracture at tight bend radii.
Traditional tensile testing (ASTM E8/E8M) provides yield strength, tensile strength, and elongation—but requires a destructive specimen cut from the strip with specific gauge dimensions, typically consuming 150-300 mm of material per test. For incoming inspection of coil-to-coil consistency or quality verification at multiple positions across a strip width, tensile testing is too slow and material-consuming to be practical.
Micro-hardness testing fills this gap. A Vickers or Knoop micro-hardness measurement on a polished copper strip cross-section can be completed in 2-3 minutes, consumes essentially zero material (the indentation is microscopic), and provides hardness values that correlate directly with the temper condition and can be converted to approximate tensile strength. For SMT lead frame manufacturers processing multiple copper alloy coils per shift, micro-hardness provides the rapid, non-destructive temper verification that tensile testing ca
ot deliver at production speed.
## Vickers vs Knoop: Two Complementary Methods
### Vickers Hardness (HV)
The Vickers method uses a square-based pyramidal diamond indenter with a 136° face angle. The indenter is pressed into the polished copper surface at a specified test force (typically 0.1-1.0 kgf for copper micro-hardness, designated HV0.1 to HV1.0), held for 10-15 seconds, then withdrawn. The two diagonals of the resulting square indentation are measured optically, averaged, and converted to the Vickers hardness number:
HV = 1.8544 × F / d²
Where F is the test force in kgf and d is the mean diagonal length in mm.
Vickers advantages for copper strip:
– Continuous scale: One hardness scale covers all copper alloys from a
ealed pure copper (40-50 HV) to hard-temper phosphor bronze (180-220 HV)—no scale changes needed
– Load flexibility: Test force can be adjusted from 0.01 kgf (HV0.01, for very thin sections) to 50 kgf (HV50, for bulk material) while maintaining comparable results
– Work-hardening insensitivity: The indentation geometry creates a relatively large plastic zone compared to the indentation size, making HV less sensitive to local work-hardening from surface preparation
### Knoop Hardness (HK)
The Knoop method uses an elongated rhombic-based pyramidal diamond indenter with a 172.5° long-axis angle and 130° short-axis angle. Only the long diagonal is measured—the Knoop number is calculated from:
HK = 14.229 × F / L²
Where F is the test force in kgf and L is the long diagonal length in mm.
Knoop advantages for copper strip:
– Shallow indentation depth: The Knoop indenter penetrates approximately half as deep as Vickers at the same test force—critical for measuring hardness of thin copper strip (0.1-0.3 mm thickness) without substrate influence
– Gradient measurement: The elongated indentation can be oriented to measure hardness gradients across a thin cross-section or near a surface (e.g., hardness change across a formed bend radius)
– Less sensitive to material pile-up: Copper alloys can exhibit material pile-up (raised edges) around Vickers indentations that affect diagonal measurement accuracy; Knoop is less affected
### Method Selection Guide
| Application | Recommended Method | Test Force | Rationale |
|—|—|—|—|
| Copper strip >0.5 mm thick | Vickers HV0.5-HV1.0 | 0.5-1.0 kgf | Standard method, well-correlated to tensile data |
| Thin strip 0.1-0.3 mm | Knoop HK0.1-HK0.2 | 0.1-0.2 kgf | Shallow penetration avoids substrate effect |
| Hardness gradient at formed bend | Knoop HK0.05-HK0.1 | 0.05-0.1 kgf | Elongated indent for gradient mapping |
| Plating hardness (Ni, Au on Cu) | Knoop HK0.025-HK0.05 | 0.025-0.05 kgf | Very shallow for thin plating layers |
| Bulk temper verification | Vickers HV1.0 | 1.0 kgf | Larger indent averages grain-to-grain variation |
## Micro-Hardness Values for SMT Copper Alloys
### Alloy-Specific Hardness by Temper
The following table provides Vickers micro-hardness ranges for common SMT copper alloys across standard temper designations, based on ASTM B601 and industry datasheets:
| Alloy | Temper Designation | Vickers HV (typical range) | Approximate Tensile Strength (MPa) | Primary SMT Application |
|—|—|—|—|—|
| C11000 (ETP Cu) | A
ealed (O60/O61) | 40-55 | 210-240 | Bus bars, thermal spreaders |
| C11000 | 1/4 Hard (H01) | 55-70 | 240-275 | Lead frame forming—simple |
| C11000 | 1/2 Hard (H02) | 70-85 | 270-310 | Lead frame forming—moderate |
| C11000 | Hard (H04) | 85-100 | 310-350 | Stamped contacts—low cycle |
| C19400 (Cu-Fe) | 1/2 Hard (H02) | 110-125 | 360-400 | IC lead frames—standard |
| C19400 | Hard (H04) | 125-140 | 400-450 | IC lead frames—high strength |
| C19210 (Cu-Fe-P) | Hard (H04) | 130-145 | 420-480 | High-density lead frames |
| C19210 | Extra Hard (H06) | 140-155 | 470-530 | Micro-lead frames |
| C26800 (65/35 Brass) | 1/4 Hard | 90-105 | 360-400 | Co
ector terminals |
| C26800 | 1/2 Hard | 110-130 | 400-460 | Stamped contacts |
| C26800 | Hard | 130-150 | 460-510 | Spring contacts—moderate |
| C51000 (Phos. Bronze) | 1/4 Hard | 130-150 | 420-480 | EMI spring contacts |
| C51000 | 1/2 Hard | 150-170 | 470-530 | High-cycle spring contacts |
| C51000 | Hard | 170-200 | 530-600 | High-reliability springs |
| C7521 (Ni-Ag-Cu) | 1/4 Hard | 90-110 | 380-440 | EMI shielding clips |
| C7521 | 1/2 Hard | 110-130 | 430-490 | Shield can spring fingers |
### Hardness-to-Tensile Strength Correlation
For copper alloys, Vickers hardness correlates approximately with tensile strength through an empirical conversion:
σ_UTS (MPa) ≈ 3.2-3.6 × HV
The conversion factor varies by alloy family:
– Pure copper (C11000): σ_UTS ≈ 3.2 × HV
– High-copper alloys (C19400, C19210): σ_UTS ≈ 3.4 × HV
– Brass (C26800): σ_UTS ≈ 3.5 × HV
– Phosphor bronze (C51000): σ_UTS ≈ 3.3 × HV
– Nickel-silver (C7521): σ_UTS ≈ 3.6 × HV
This conversion provides a rough tensile strength estimate but should not replace direct tensile testing for certification purposes. Use micro-hardness for process control and lot-to-lot comparison; use tensile testing for certificate of compliance documentation.
## ASTM E384: The Standard Test Method
### Key Requirements for Copper Strip Testing
ASTM E384 “Standard Test Method for Microindentation Hardness of Materials” specifies the procedures and requirements for Vickers and Knoop micro-hardness testing. Key requirements for copper strip:
– Test force: Select the highest force that does not cause cracking or produce an indentation diagonal less than 20 μm (below 20 μm, optical measurement uncertainty becomes significant relative to diagonal length). For copper strip at 0.2-0.5 mm thickness, HV0.2-HV0.5 is appropriate.
– Test force application: Apply test force smoothly over 5-10 seconds; hold at full force for 10-15 seconds; withdraw smoothly. Rapid loading or unloading produces inaccurate results.
– Indentation spacing: Center-to-center spacing between indentations must be at least 3× the diagonal length for copper to prevent work-hardening influence from adjacent indentations.
– Edge distance: Indentations should be at least 2.5× the diagonal length from any edge (strip surface, cross-section edge) to avoid edge-effect distortion.
– Surface preparation: Copper strip must be metallographically polished to 1 μm diamond or 0.05 μm colloidal silica finish. Surface roughness from as-rolled or as-stamped surfaces produces unreliable, scattered hardness values.
– Number of indentations: Minimum 5 indentations per test location; report mean and standard deviation. Single-indentation measurements are not statistically valid.
– Instrument verification: Verify tester calibration using certified hardness reference blocks at hardness values bracketing the expected range. Perform daily verification before production testing.
### Common Sources of Error
| Error Source | Effect on Hardness | Prevention |
|—|—|—|
| Inadequate surface polish | HV values scattered ±10-20% | Polish to ≤1 μm diamond finish |
| Vibration during test | Falsely low HV (larger indent) | Vibration isolation table; rigid mounting |
| Incorrect test force calibration | Systematic bias | Daily verification with certified test blocks |
| Optical measurement error | Random scatter ±5-10% | Calibrated measurement system; automated if possible |
| Work-hardened surface layer (from cutting) | HV 10-20% too high | Remove 50-100 μm by polishing |
| Adjacent indent influence | Variable | Maintain minimum 3× diagonal spacing |
| Edge proximity (<2.5× diagonal) | HV 15-25% too low | Ensure adequate edge distance |
| Material pile-up around indent | HV 5-10% too high (overestimated diagonal) | Use Knoop for pile-up-prone alloys (brass) |
## Production Implementation for Lead Frame QC
### Incoming Inspection Protocol
For each received copper strip coil destined for SMT lead frame stamping:
1. Sample preparation: Cut a 25 mm × strip-width sample from the coil end. Mount in cold-curing epoxy (avoid hot mounting—heat can alter temper). Polish the cross-section to 1 μm finish.
2. Test locations: Measure at 5 positions across the strip width (left edge, 1/4 width, center, 3/4 width, right edge) to detect cross-width hardness variation from non-uniform rolling reduction.
3. Perform 5 indentations at each location (25 total per sample) at HV0.3 or HV0.5.
4. Calculate: Mean, standard deviation, and range (max-min) at each location and across the full strip width.
5. Accept/Reject:
– Mean HV within the specified temper range → Accept
– Mean HV outside range → Reject
– Cross-width HV range > 10% of mean → Investigate (non-uniform temper may cause uneven forming and springback)
– Standard deviation > 5% of mean at any location → Investigate (local microstructural variation)
### Process Monitoring
After setup verification, production monitoring uses a simplified protocol:
– One sample per 500 kg of strip processed
– 3 locations across width (left, center, right)
– 3 indentations per location
– Plot mean HV on a control chart with ±2σ control limits
– Investigate excursions: process change, different raw material lot, or measurement error
### Troubleshooting Hardness Anomalies
| Observation | Possible Cause | Corrective Action |
|—|—|—|
| Mean HV too high across entire width | Temper harder than specified | Return to supplier; verify order specification |
| Mean HV too low across entire width | Temper softer than specified; incomplete cold work or over-a
ealed | Return to supplier; verify a
ealing parameters |
| HV higher at strip edges than center | Non-uniform rolling reduction (more reduction at edges) | Discuss with supplier rolling process; may affect forming consistency |
| HV lower at strip edges than center | Non-uniform a
ealing (edges heat/cool faster) | Discuss with supplier a
ealing process |
| HV scatter >10% at single location | Local grain size variation; improper polishing | Re-polish and re-test; if persists, metallographic grain size analysis |
| HV shift from coil start to coil end | Process drift during coil production | Longitudinal sampling at coil start, middle, end |
## Integration with Stamping Process Design
### Using Hardness Data for Die Setup
Micro-hardness data directly informs progressive die setup parameters:
– Higher-than-specified hardness → Increase forming force; increase bend radius allowance to prevent cracking; adjust springback compensation (harder material springs back more)
– Lower-than-specified hardness → Reduce forming force; material will form more easily but produce less springback; check that formed contacts achieve minimum retention force
– Cross-width hardness variation → Consider sorting strip into hardness bands for critical forming stations; adjust die setup for worst-case hardness condition
### Hardness and Formability
Hardness inversely correlates with formability—as hardness increases (through cold work), the remaining ductility for forming decreases:
| Alloy | Temper | HV | Approximate Minimum Bend Radius (× thickness) |
|—|—|—|—|
| C11000 | A
ealed | 45 | 0.5t (tight) |
| C11000 | 1/4 Hard | 62 | 1t |
| C11000 | 1/2 Hard | 78 | 1.5t |
| C11000 | Hard | 92 | 2t |
| C19400 | 1/2 Hard | 118 | 1.5t |
| C19400 | Hard | 132 | 2t |
| C26800 | 1/4 Hard | 98 | 1.5t |
| C26800 | 1/2 Hard | 120 | 2t |
| C51000 | 1/2 Hard | 160 | 2t |
| C51000 | Hard | 185 | 3t |
If incoming inspection reveals hardness above specification, the minimum bend radius must increase proportionally—or forming cracks will occur at radii that were acceptable for the specified temper.
## Conclusion: Micro-Hardness as a Process Control Foundation
Micro-hardness testing by Vickers or Knoop methods provides SMT lead frame manufacturers with a rapid, precise, and nearly non-destructive temper verification tool that complements—but does not replace—tensile testing. The ability to verify hardness at 5 positions across a strip width in 30 minutes enables incoming inspection that catches temper deviations before they reach the stamping press, preventing the forming defects, springback variation, and progressive die damage that incorrect temper causes.
For Southeast Asia SMT component manufacturers receiving copper strip from multiple global suppliers with varying process control maturity, micro-hardness QC provides an objective, quantitative acceptance criterion that replaces subjective “feels right” assessments. When integrated with statistical process control charting and correlated with stamping process parameters, micro-hardness data becomes a foundational element of the manufacturing quality system—detecting material variation early, enabling proactive die setup adjustment, and reducing the defect rate from temper-related forming problems.